Animations, interactive elements, and Shiny
2024-10-09
Reminders, previously, and today…
Infographic is due Friday night!
You should be working on your presentations for Jamie…
Walked through basics of text data with bag-of-words representation
Created word cloud visualizations of counts and bar charts of TF-IDF values
TODAY:
Discuss the role of animations
Walk through interactive visualizations
Introduction to Shiny for creating apps
Storytelling with animation…
Storytelling with animation…
Use gganimate to add animations
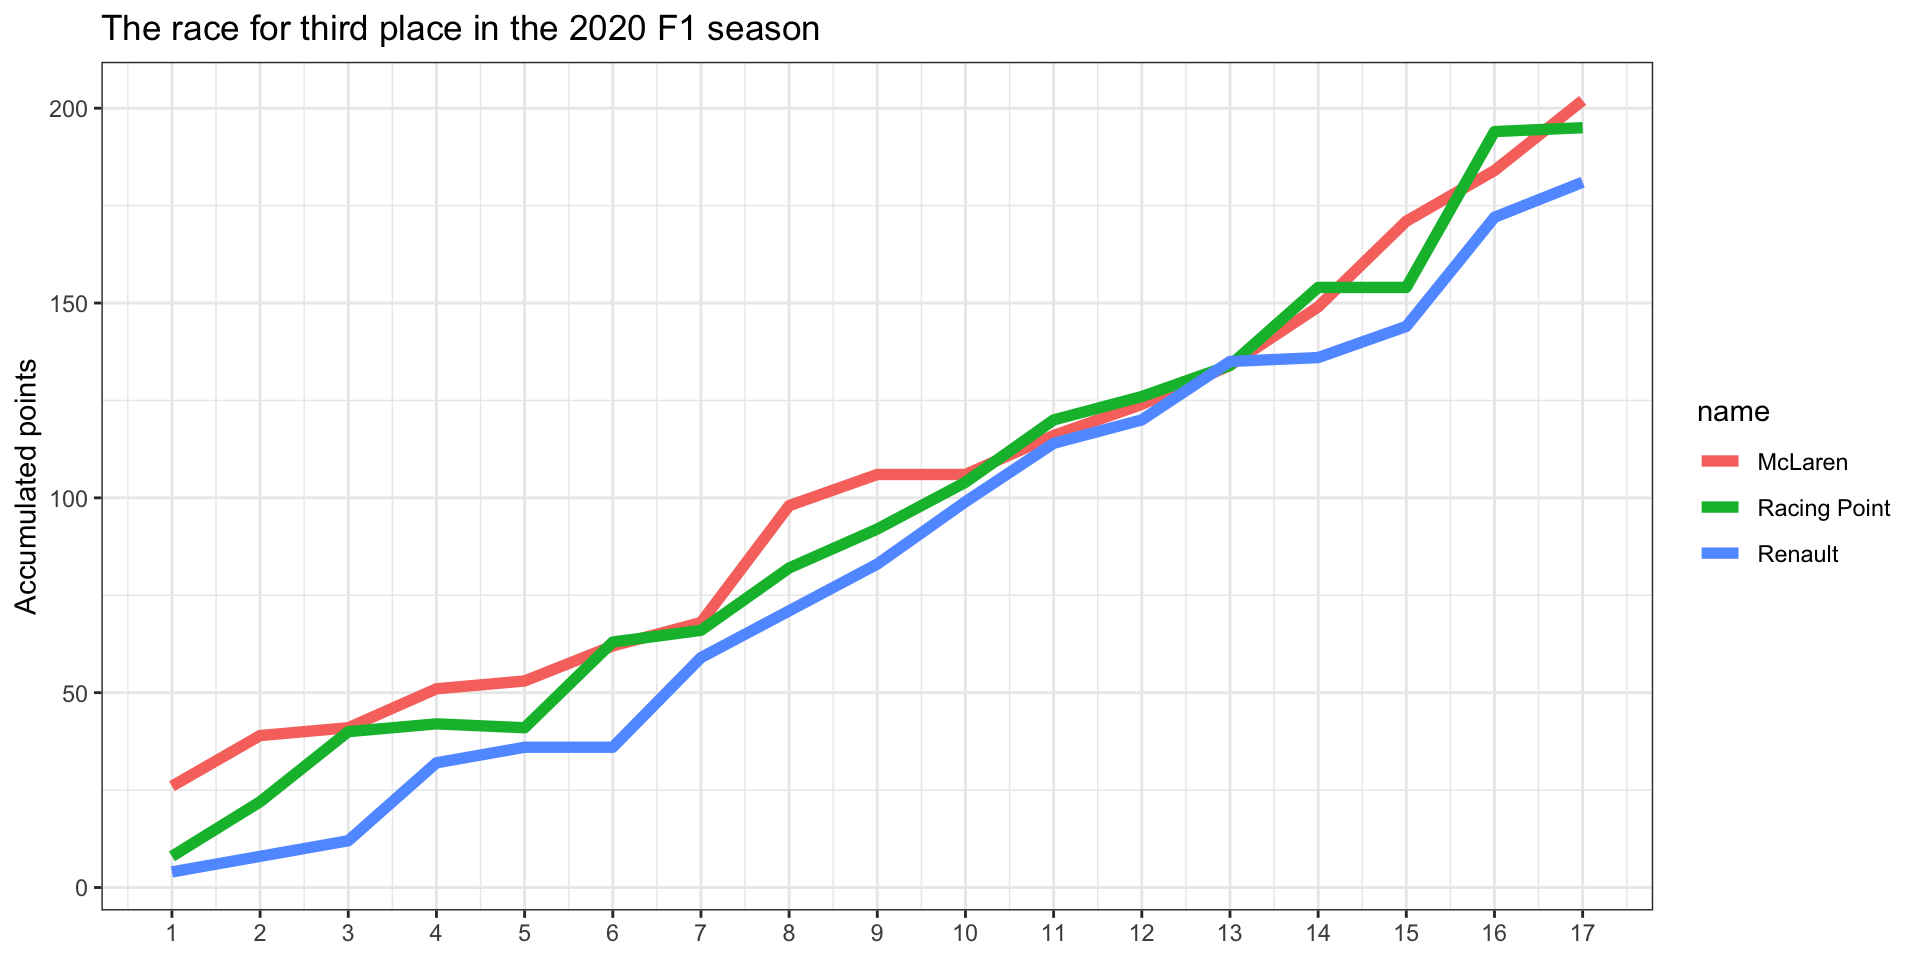
We could incrementally reveal the results at each stage to emphasize the story of progression
library(gganimate)
f1_data_ex |>
  ggplot(aes(x = round, y = points, group = name, color = name)) +
  geom_line(size = 2) +
  scale_x_continuous(breaks = seq(1, 17, 1)) +
  labs(title = "The race for third place in the 2020 F1 season",
       y = "Accumulated points", x = NULL) +
theme_bw() +
transition_reveal(round)Use gganimate to add animations
Using animation to add a dimension
txhousing |>
  group_by(city, year) |>
  summarize(median = mean(median, na.rm = TRUE),listings = mean(listings, na.rm = TRUE)) |>
  ggplot(aes(x = median, y = listings, color = (city == "Houston"),
             size = (city == "Houston"))) +
  geom_point(alpha = 0.5, show.legend = FALSE) +
  scale_color_manual(values = c("black", "darkred")) +
  scale_size_manual(values = c(2, 4)) +
  scale_x_continuous(labels = scales::dollar, name = "Median Price") +
  scale_y_continuous(labels = scales::label_number(scale_cut = scales::cut_short_scale())) +
  theme_bw() +
  labs(x = "Median Price", y = "Avg. of Monthly Listings",
       subtitle = "Houston in red")
Using animation to add a dimension
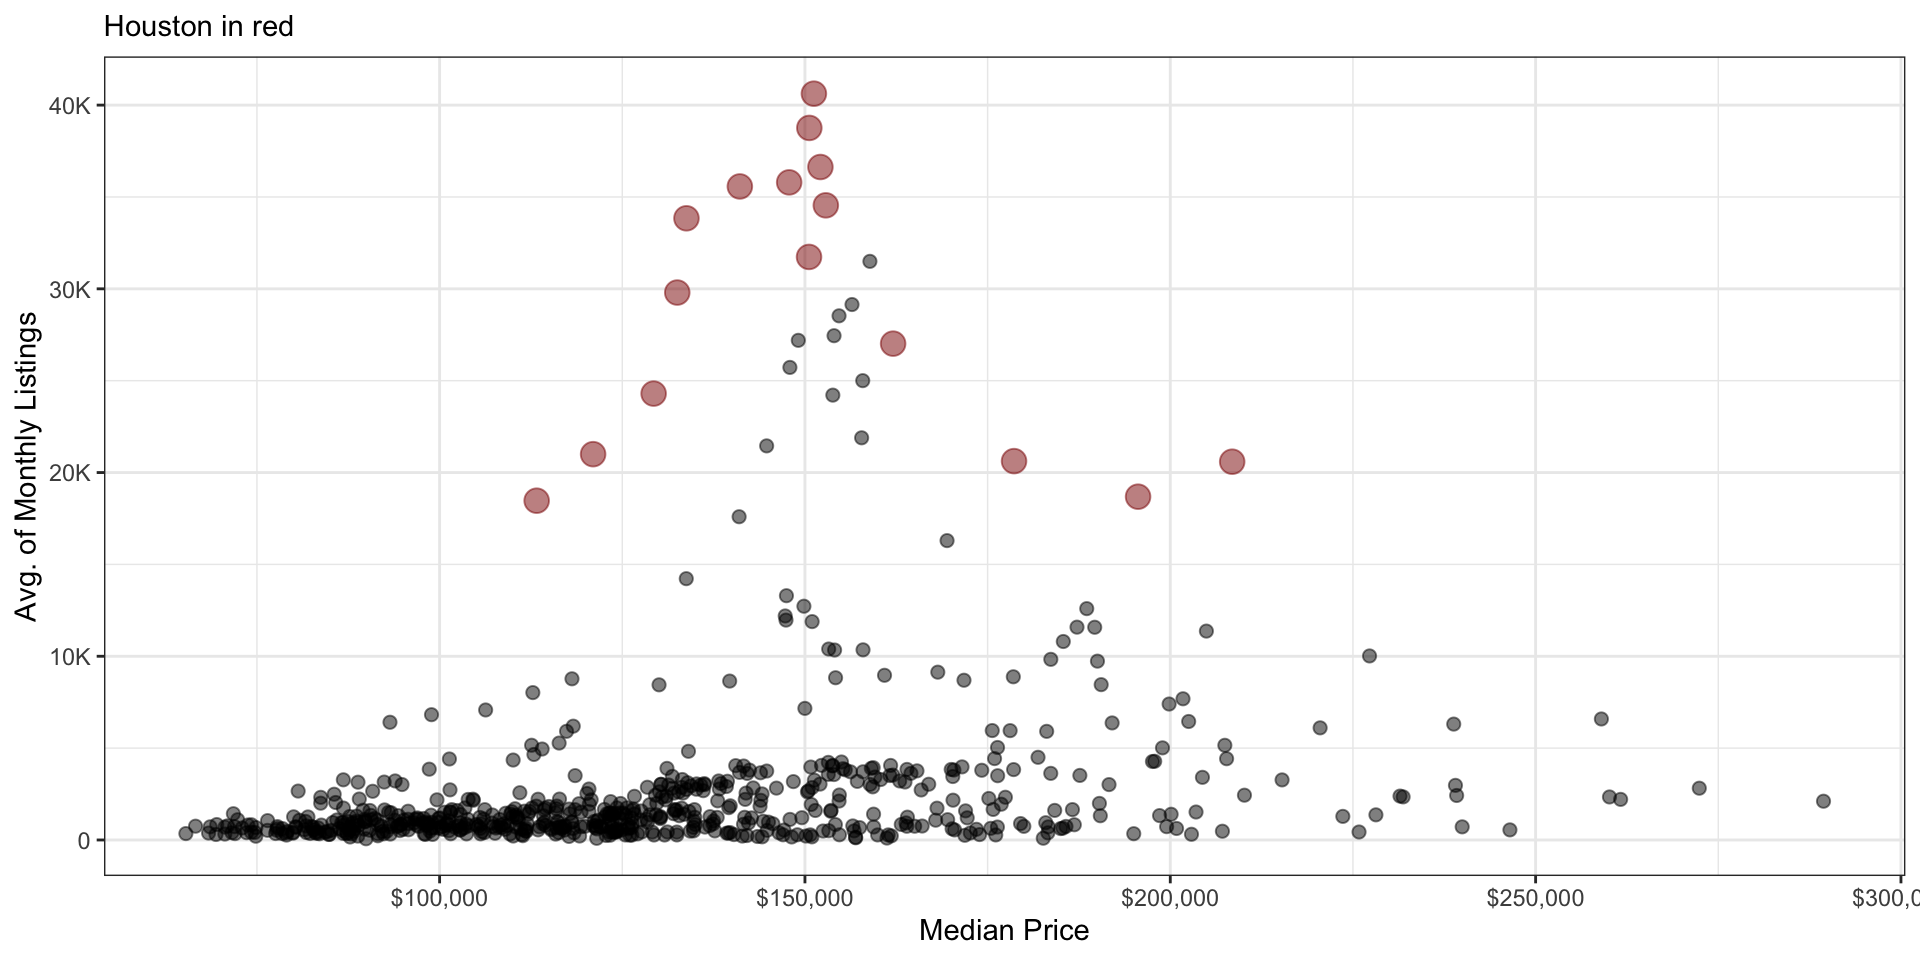
Using animation to add a dimension
txhousing |>
  group_by(city, year) |>
  summarize(median = mean(median, na.rm = TRUE), listings = mean(listings, na.rm = TRUE)) |>
  ggplot(aes(x = median, y = listings, color = (city == "Houston"),
             size = (city == "Houston"))) +
  geom_point(alpha = 0.5, show.legend = FALSE) +
  scale_color_manual(values = c("black", "darkred")) +
  scale_size_manual(values = c(2, 4)) +
  scale_x_continuous(labels = scales::dollar, name = "Median Price") +
  scale_y_continuous(labels = scales::label_number(scale_cut = scales::cut_short_scale())) +
  theme_bw() +
  labs(x = "Median Price", y = "Avg. of Monthly Listings",
       subtitle = "Houston in red", title = "Year: {frame_time}") +
  transition_time(year)
Using animation to add a dimension
Reminders about animation
Some key points to think about before adding animation to a visualization:
- Always make and describe the original / base graphic first that does NOT include animation.
- Before adding animation to the graph, ask yourself: How would animation give you additional insights about the data that you would otherwise not be able to?
- Never add animation just because it’s cool!
- When presenting, make sure you explain exactly what is being displayed with animation and what within the animation you want to emphasize. This will help you determine if animation is actually worth including.
A bridge between R and JavaScript
JavaScript enables web developers to create client-side web applications
Computations are happening in the client’s browser, instead of the host’s web servers
D3(orD3.js) is the most popular JavaScript library for client-side dynamic data visualizationsD3== ‘data-driven documents’
RStudio developers created the
htmlwidgetsenablingRusers to useD3without needing to learn JavaScript!Renders data visualizations in HTML using
D3wrappers- Incredible gallery with a variety of uses, including a chess package called
rchess!
- Incredible gallery with a variety of uses, including a chess package called
Leaflet: interactive HTML maps
addTiles(): builds layer with static map (default from OpenStreetMap)addMarkers(): add marker at point location, e.g., CMUUse
tidygeocoderfor spatial queries
Leaflet: interactive HTML maps
DataTables (DT) package for interactive tables
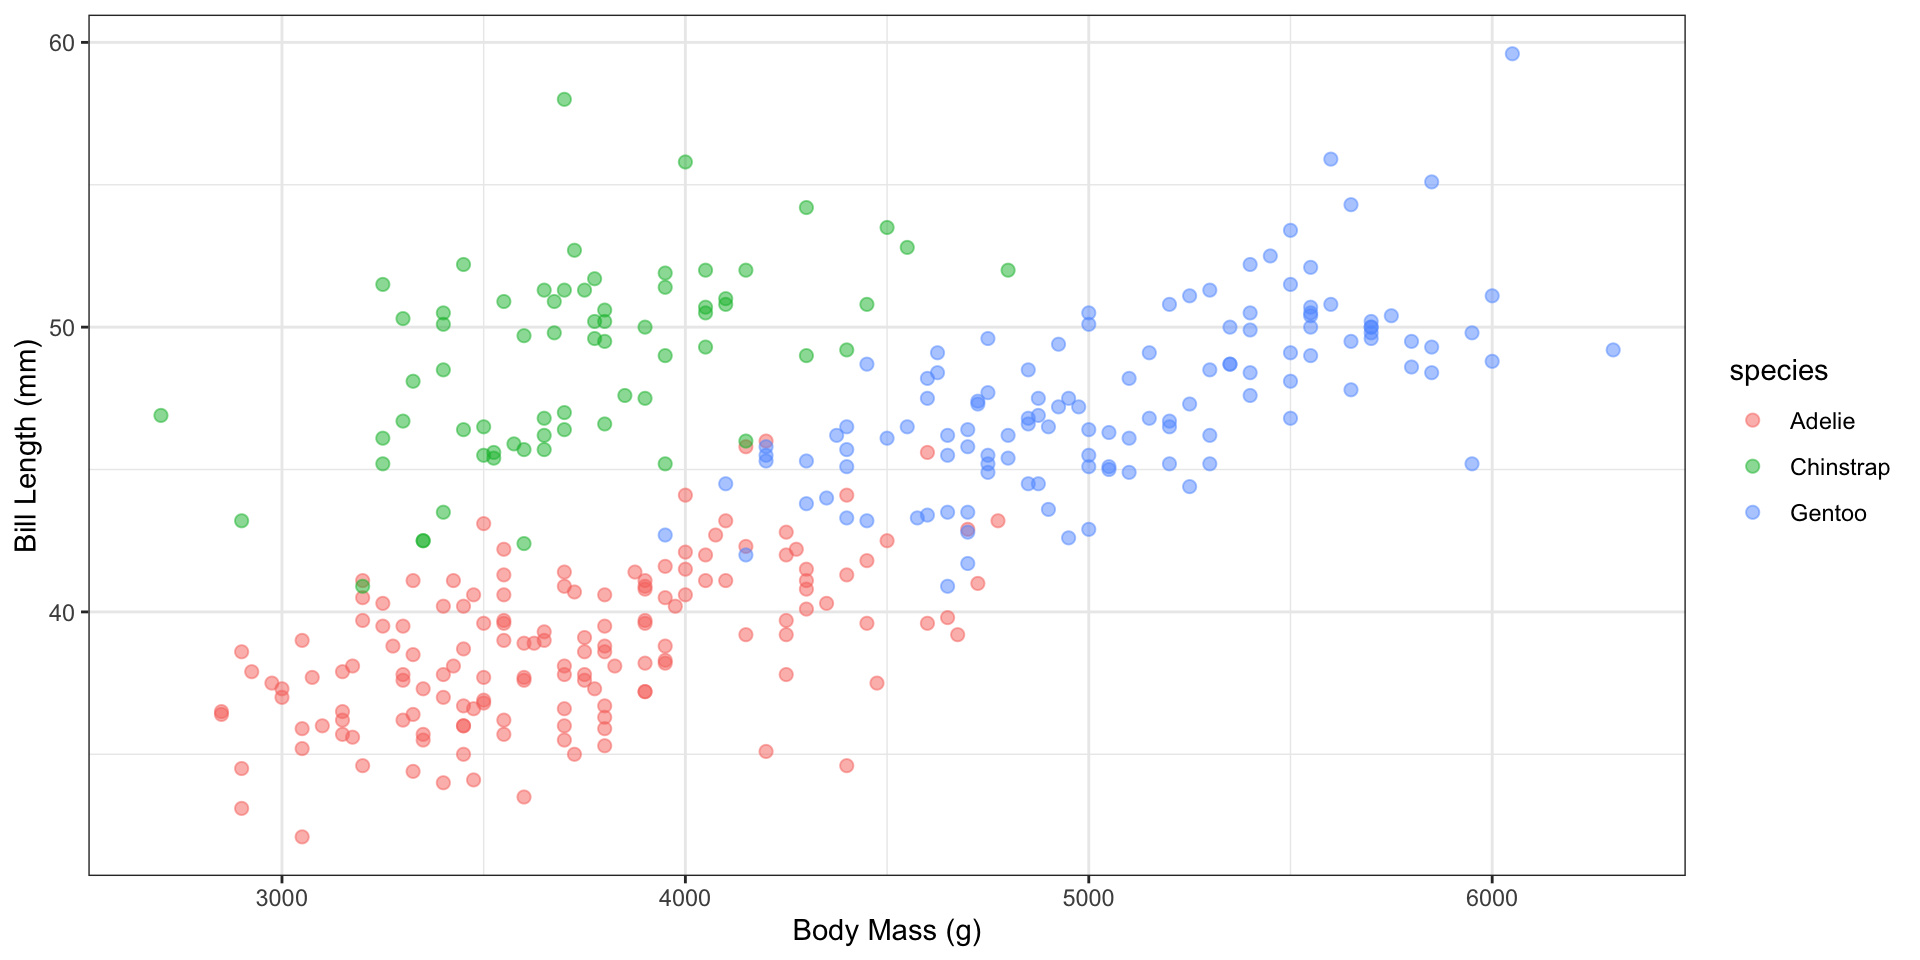
We have a plain plot…
We have a plain plot…
Make it interactive with Plotly!
Customize the tooltip
Customize the tooltip
Putting it all together with dashboards
Dashboards are popular way to make data and visualizations available to clients, managers, stakeholders, etc. to help with decision making
Typically include a mix of graphics and text, depending on the context
Can easily make HTML dashboards using the
flexdashboardpackageProvide interactive capabilities within an HTML file (i.e., you can email this!)
These are NOT fully interactive like Shiny apps
You can use Shiny within
flexdashboardbut it requires a Shiny serverAnother option is
shinydashboard
More recently, Quarto dashboards are now possible
Outside of
R, Tableau is a popular tool (can use free Tableau Public version)
Interactive web apps with Shiny
Shiny is used to build interactive web applications in R
You do NOT need to be a web developer to create Shiny apps, you just need to learn some additional syntax to augment your R code
Every Shiny app consists of two scripts (can be saved into one file app.R)
ui.R: controls user interface, sets up the display, widgets for userinput
- New code specific to Shiny
server.R: code to generate / display the results! Communicates withui.Rwith reactive objects: processes userinputto returnoutput
- Traditional
Rcode: load packages, data wrangling, create plots
Can be run locally or deployed on a Shiny app server for public viewing
DO IT LIVE
Recap and next steps…
Discussed the role of animation in visualizations
Overview of different interactive elements and basics of Shiny
I never discussed making fancy tables, but check out the
gtpackage
Infographic is due Friday night!
Hope you enjoyed the class, please complete the FCEs!
More reading:
gganimatepackage, using Shiny within Quarto, Mastering Shiny book
